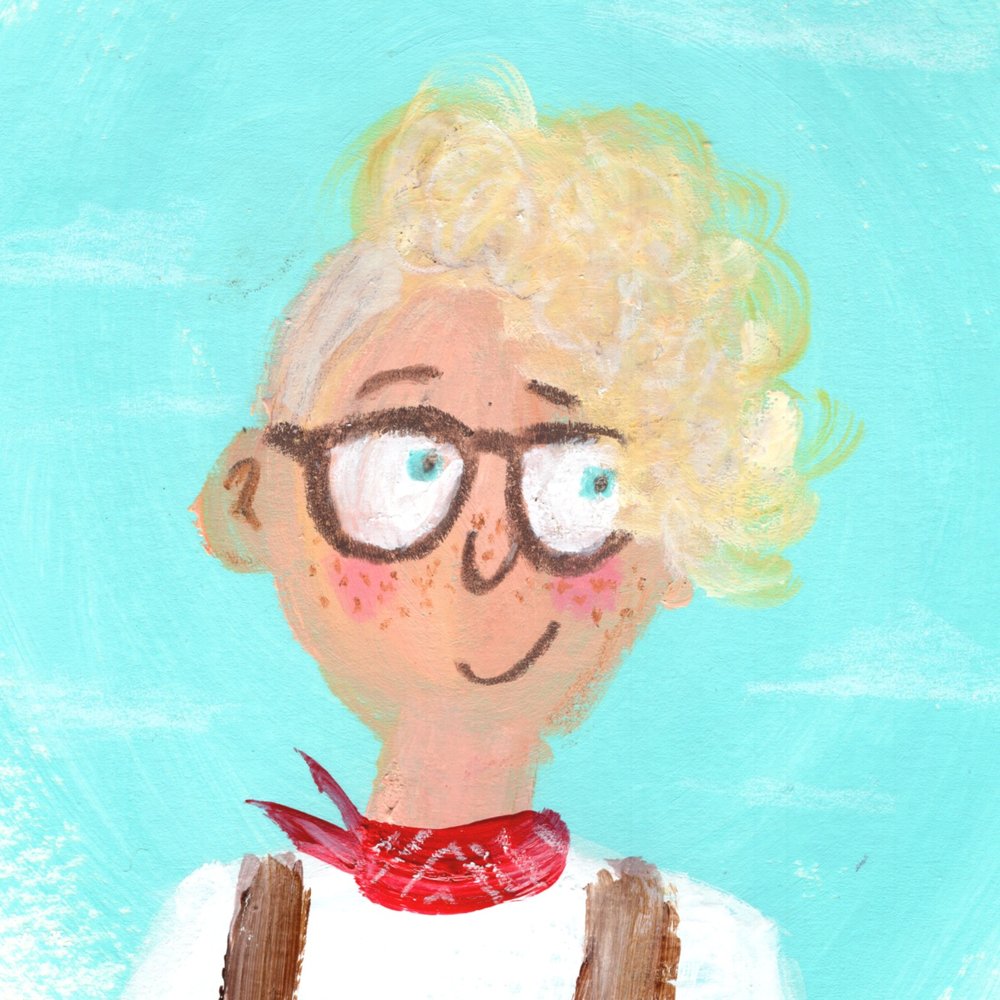
Hi, I'm Em. I’m a freelance data visualisation designer and director living in the UK.
I started out in Operational Research and Statistics, and have gradually shifted from building models and leading analytics teams to communicating, and visualising data, making it easy to understand, and beautiful to look at.
I’m also an illustrator, love helping analytical teams learn design skills, (it's not as hard as it looks!) and speaking about my work. You can see my CV here, and previous projects here.
I think that
understanding data shouldn't be hard, and it shouldn't be boring. I can help you craft compelling data stories that don't give users glazed eyes. From dashboards to digital products and everything in between.
Users come first
even though sometimes it feels like dashboards and vizzes ignore them. My process starts with the users and how you want them feel about the data, testing as early and often as possible. I also run an Intro to UX design workshop for analysts to help them develop skills to transform their own products. It was once called 'the best 3 hours of my week' by one attendee. For real.
If you're excited about working on a project together or you'd like to arrange training, get in touch :)

